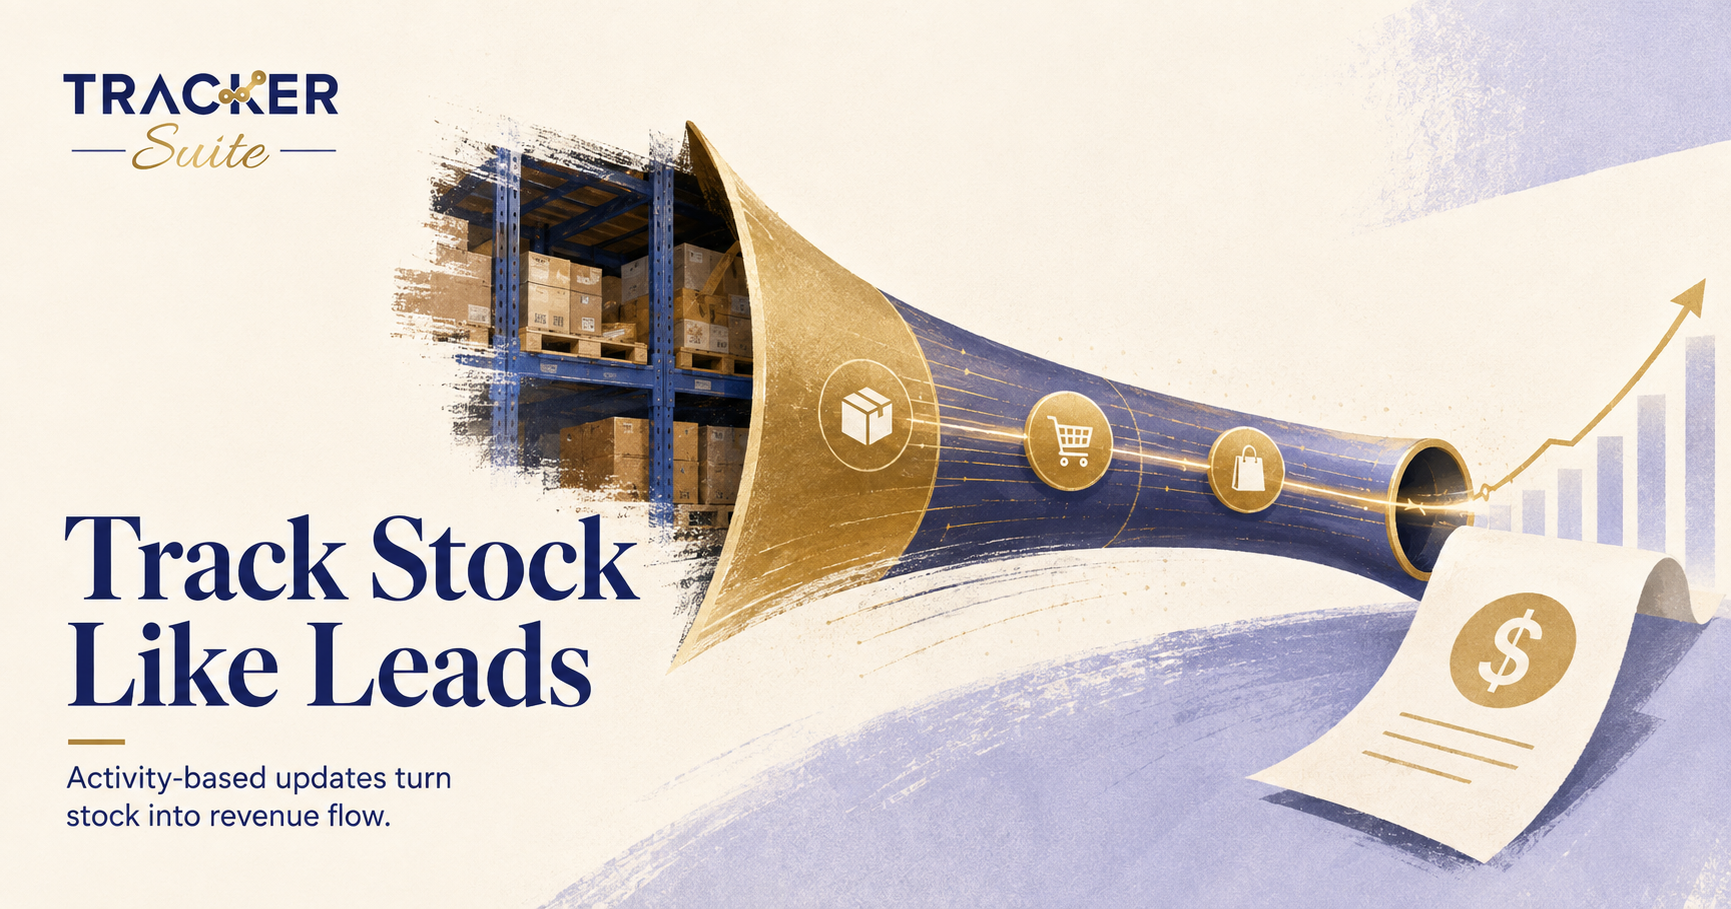
Most businesses track sales leads in a pipeline but treat inventory as a static list. This guide explains how an inventory to sales funnel, powered by activity-based updates, lets you track SKU conversion, protect revenue, and choose the right management software when spreadsheets stop scaling.
Stock sitting in a warehouse is not revenue. It only becomes revenue when it moves through a defined sequence of stages and reaches a paying customer. That sequence is the inventory to sales funnel, and most businesses manage it with spreadsheets that go out of date the moment they are saved. This guide explains how activity-based updates keep the funnel accurate, how to measure SKU conversion, and how to decide when you need dedicated management software.
Key takeaways
- The inventory to sales funnel treats every unit of stock like a lead moving through a pipeline, from procurement to recognized revenue.
- Activity-based updates refresh stock data the moment an event happens, replacing end-of-day manual entry that sales teams cannot trust.
- Poor data quality is the main barrier: 87% of operations leaders in PwC’s 2026 Digital Trends in Operations survey said weak data undermined the value of their digital initiatives.
- You can track SKU conversion with a small set of funnel metrics: sell-through rate, days in stage, and stage-level conversion.
- A very small operation may only need a spreadsheet. Multiple locations, shifts, or high SKU counts usually justify an operations platform.
At a glance
- Problem: Inventory and sales data live in separate systems, so teams oversell, overstock, and lose revenue.
- Cost of the gap: Inventory distortion (stockouts plus overstock) cost retailers an estimated $1.77 trillion globally in 2023 (IHL Group, 2023).
- Fix: A funnel model with activity-based updates so every stock movement is recorded as it happens.
- Who this is for: Distributors, wholesalers, manufacturers, and multi-location retailers with growing SKU counts.
- Time to value: A focused rollout across one product category can run in about 90 days.
What is the inventory to sales funnel and how does it work?
The inventory to sales funnel is a model that tracks each product from purchase order to recognized revenue, using the same stage logic a sales team applies to leads. Instead of asking “where is the deal,” managers ask “where is the stock,” and they can see which stage is leaking money. Five stages make up a typical funnel.
- Procurement and inbound transit. A purchase order is placed. Capital is committed, but the product cannot yet be sold. Lead times and transit status define how long cash sits idle.
- Receiving and warehousing. Goods arrive, are inspected, and are allocated. In multi-location businesses, allocation is a strategic choice: which warehouse or store gets stock based on regional demand.
- Sales engagement. The product is quoted, marketed, and sold. This is where alignment breaks down if sales teams cannot see real stock levels.
- Fulfillment and dispatch. The item is picked, packed, and shipped. This stage carries the highest risk of human error.
- Revenue realization. Delivery is confirmed and revenue is recognized in the accounts. Returns push the item back into the middle of the funnel.
The goal is velocity: the less time a unit spends in the middle, non-revenue stages, the healthier your cash flow. Companies that learn how to track sales alongside stock, rather than in a separate tool, can see exactly where velocity dies.
Why do inventory and sales teams fall out of sync?
The short answer: the two functions update their records at different times, in different systems, with different definitions of “available.” Warehouse staff update spreadsheets at the end of a shift. Sales teams work from yesterday’s export. By the time anyone reconciles the two, deals have been promised against stock that no longer exists.
The financial scale of this disconnect is large. IHL Group estimated that inventory distortion, the combined cost of stockouts and overstock, reached $1.77 trillion worldwide in 2023 (IHL Group, 2023). That figure matters because most of it is not caused by bad demand forecasting. It is caused by information arriving too late to act on.
Technology alone does not close the gap. The research consistently points at data quality as the binding constraint:
Only 2% of manufacturing COOs said AI was fully embedded across their operations, while 46% reported data or IT/OT limitations holding them back (McKinsey, 2025).
PwC’s 2026 Digital Trends in Operations survey adds the operational detail: 87% of operations leaders said poor data quality limited the value they got from digital initiatives (PwC, 2026). The lesson for any business running an inventory to sales funnel is simple. Before automation or AI can help, the underlying stock data has to be captured accurately and continuously. That is exactly the problem activity-based updates solve.
How do activity-based updates keep the funnel accurate?
Activity-based updates mean every physical event, a receipt, a transfer, a pick, a sale, a return, updates the system at the moment it happens, rather than in a batch at the end of the day. The funnel then reflects reality in near real time. Sales sees what is actually available, and purchasing sees what is actually selling.
Consider a building materials distributor with three warehouses and about 4,000 SKUs. Under the manual model, a counter sale in one city is written on a pad and keyed into a spreadsheet that evening. Meanwhile, a salesperson in another city quotes the same last pallet of tiles to a contractor. The result is an angry customer, an emergency transfer, and a margin hit.
With activity-based updates, the counter sale adjusts available stock instantly. The second salesperson sees the pallet is committed and quotes an alternative warehouse or a realistic lead time instead. Nothing about the staff or the product changed. Only the timing of the data changed.
This event-driven approach also creates an audit trail. Every movement records who moved what, when, and why, which matters for compliance, shrinkage investigations, and process improvement. When the record is complete, managers stop chasing updates by phone and start managing by exception.
How do you track SKU conversion and inventory revenue tracking?
You track SKU conversion the same way you track lead conversion: define the stages, measure how many units enter each stage, and measure how many exit to the next one. Inventory revenue tracking then attaches a currency value to each stage, so you can see not just where units stall, but how much cash is stalled with them.
A practical starter set of funnel metrics:
- Sell-through rate: Units sold divided by units received in a period, per SKU. Low sell-through flags overstock risk early.
- Days in stage: How long a typical unit spends in receiving, warehousing, and fulfillment. Long dwell times reveal process bottlenecks.
- Stage-level conversion: The percentage of received stock that reaches dispatch within your target window, broken down by location.
- Revenue in funnel: The sales value of stock currently committed to open orders, compared with stock sitting unallocated.
- Return rate by SKU: Items looping back into the funnel, which erodes both margin and customer trust.
Effective sales tracking depends on these numbers being current. A weekly report built from stale exports tells you where the funnel was. Activity-based data tells you where it is, which is the only version you can act on.
When is a spreadsheet enough, and when do you need management software?
A spreadsheet is enough when one person owns the stock, one location holds it, and movement volume is low. Excel works well for simple tracking, and forcing a platform onto a five-person operation adds cost without adding control. The tipping point comes with scale, not with a specific SKU count.
Use this checklist to judge your own situation:
- Stock is held in more than one location or warehouse.
- Multiple teams (sales, warehouse, purchasing) update the same records.
- You run shifts, so no single person sees the full day.
- Managers spend hours each week chasing status updates by phone or chat.
- Returns, transfers, or adjustments are frequent enough to corrupt manual counts.
- Leadership asks for reports that take days to compile.
If several of these apply, a management software project is usually the next step. The mistake many teams make is treating that project as an IT purchase rather than an operations redesign. Before you compare management project software options, map the funnel stages above and decide which events must be captured live. Whether you shortlist pm project management software for coordinating the rollout, an ERP module, or a dedicated operations platform, the evaluation criteria stay the same: real-time stock visibility, an auditable activity trail, location-level reporting, and alerts that fire before stock becomes a problem.
What this means for you
If you run operations, sales, or finance at a growing distributor, wholesaler, or manufacturer, the funnel model gives you a shared language. Sales stops blaming the warehouse, the warehouse stops blaming purchasing, and everyone looks at the same staged data.
Start small and concrete. Pick one product category with visible pain, such as frequent stockouts or heavy returns. Define its five funnel stages, agree which events get recorded live, and measure sell-through and days in stage for one quarter. That pilot gives you the baseline evidence to justify a wider rollout, and it exposes which data habits need fixing before any software can help.
If your business is still small and single-site, keep the spreadsheet but adopt the funnel structure now. Staged columns and a daily update habit cost nothing, and they make a future migration far easier.
How does TrackerSuite fit into the inventory to sales funnel?
TrackerSuite’s Stack Tracker is built around the same event-driven logic this article describes. Stock moves through structured stages with activity-based updates, so records stay accurate without end-of-shift data entry. Low-stock alerts notify teams before a shortage reaches the customer, and an inventory to sales funnel view shows how SKUs convert into revenue, similar to tracking leads through a pipeline.
For multi-location businesses, location-wise stock assignment and location performance reports show which sites sell faster and which need attention. Order lifecycle tracking follows each order from placement to delivery, and stock movement history records who moved what, when, and why, supporting both accountability and audits. TAVI, the platform’s AI layer, assists with prioritization and visibility across locations based on configured rules and available data, while people remain responsible for commercial decisions.
The fit is strongest for businesses past the spreadsheet tipping point: multiple locations or teams, recurring stock movements, and managers who currently chase updates manually. A solo operation with a handful of SKUs would not need this level of system.
How do you implement a funnel system in 90 days?
A staged rollout beats a big-bang launch. A realistic 90-day sequence looks like this:
- Days 1 to 15: Map the funnel. Document your stages, owners, and the events that move stock between them. Identify where data currently goes stale.
- Days 16 to 30: Clean the data. Standardize SKU naming, units of measure, and location codes. Automation built on inconsistent master data fails fast.
- Days 31 to 60: Pilot one category. Run activity-based updates for a single product group at one site. Train the team on recording events live rather than in batches.
- Days 61 to 75: Measure and adjust. Compare sell-through, days in stage, and count accuracy against your baseline. Fix process gaps before expanding.
- Days 76 to 90: Scale deliberately. Extend to remaining categories and locations, add alerts and dashboards, and set a weekly funnel review with sales and operations together.
The human side matters as much as the tooling. Staff need to understand why live updates protect their own time, not just feed a dashboard.
Frequently asked questions
What is the difference between an inventory funnel and a sales funnel?
A sales funnel tracks prospects from first contact to closed deal. An inventory funnel applies the same stage logic to physical stock, tracking units from purchase order to recognized revenue. Connecting the two shows whether promised deals can actually be fulfilled.
How do I know if my inventory data is too stale to trust?
Test it. Pick ten SKUs and compare the recorded quantity against a physical count at a random hour. If discrepancies appear regularly, or your team hesitates to quote against system numbers, your update cadence is the problem.
Can a small business use an inventory to sales funnel without software?
Yes. A spreadsheet with one column per funnel stage and a daily update routine captures most of the benefit for a single location. Software becomes worthwhile when multiple people, sites, or shifts share the same stock.
What metrics should I review weekly?
Sell-through rate by SKU, days stock spends in each stage, revenue value committed to open orders, and return rates. Four numbers, reviewed together by sales and operations, catch most funnel problems early.
Conclusion
The inventory to sales funnel reframes stock as pipeline: every unit is a potential revenue event moving through measurable stages. Activity-based updates keep that picture honest, and a small set of conversion metrics tells you where cash is stalling. Start with one category, prove the model, then scale it across locations with a system built for live data.
If your team has outgrown spreadsheets, see how Stack Tracker handles activity-based updates, funnel visibility, and multi-location stock in one platform. Review TrackerSuite pricing to find a plan that fits, including a free starter tier.
Leave a Reply