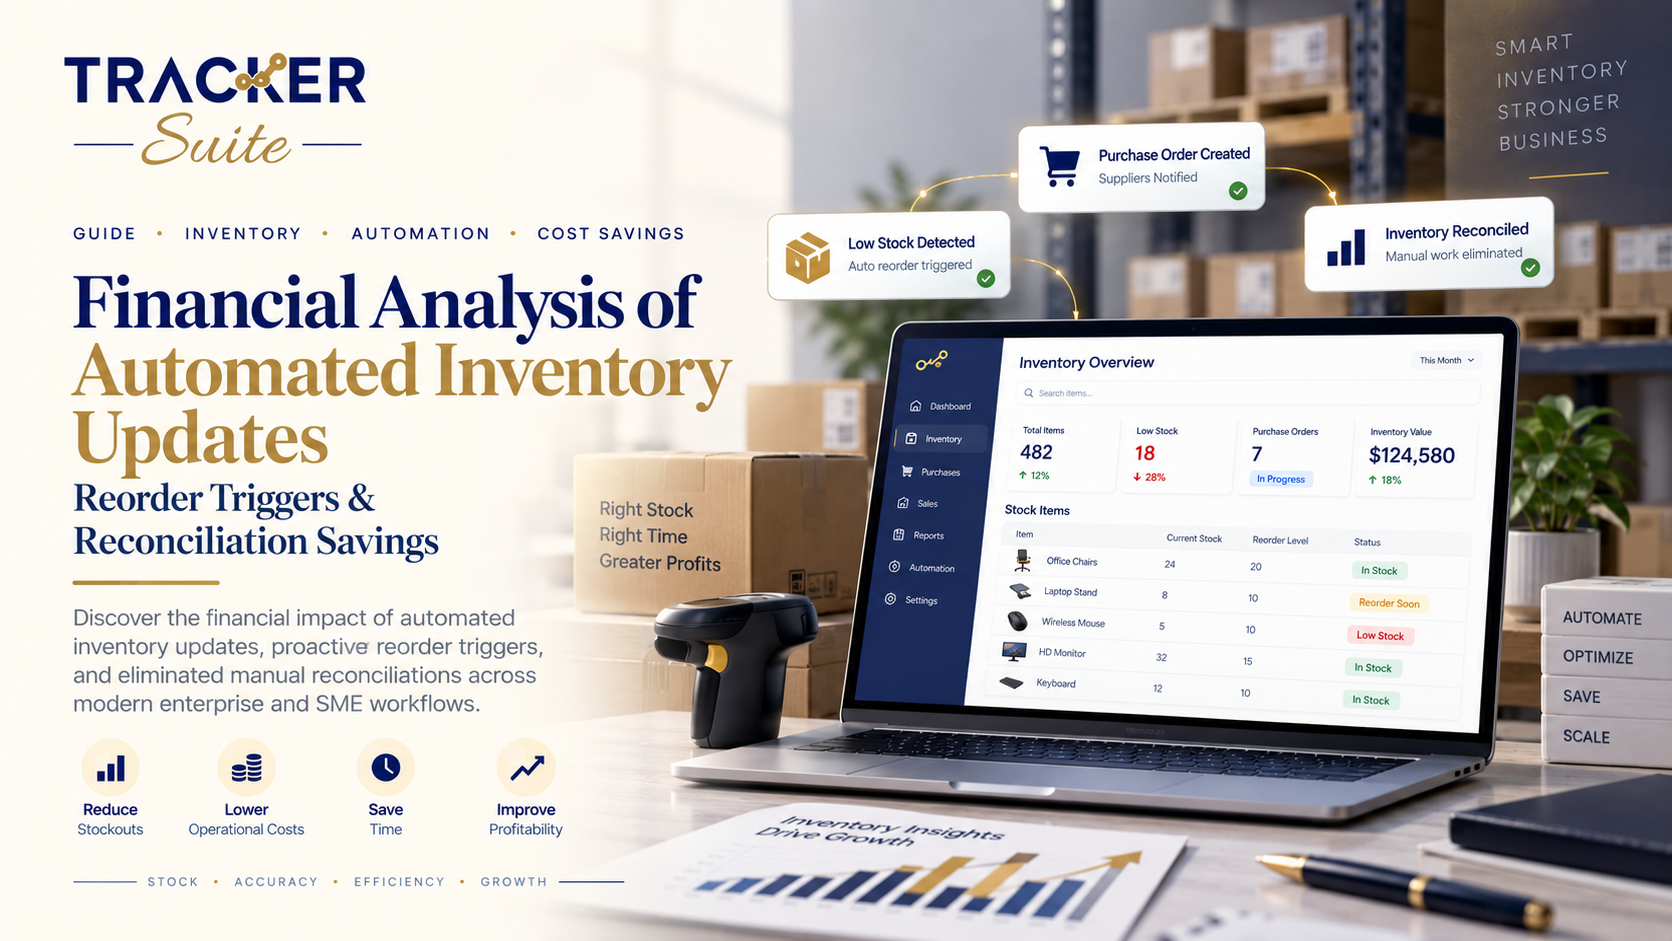
For growing businesses and established organizations alike, working capital tied up in inventory represents one of the largest items on the balance sheet. Yet, traditional inventory controls still rely on fragmented spreadsheets, delayed cycle counts, and manual stock updates. When physical tallies diverge from digital logs, the resulting discrepancies cascade across purchasing, fulfillment, accounting, and leadership teams.
A rigorous financial analysis reveals that the true cost of manual stockkeeping extends far beyond administrative hours. It includes stockout penalties, emergency shipping surcharges, deadstock write-offs, and compromised strategic planning. Transitioning to automated inventory updates, activity-based workflow tracking, and proactive reorder triggers eliminates these systemic losses while unlocking substantial operational leverage.
The True Financial Drag of Manual Reconciliations
Manual reconciliation is frequently treated as an unavoidable cost of doing business. In practice, it acts as an invisible tax on productivity, accuracy, and capital allocation.
1. Direct Labor and Opportunity Costs
Consider an organization handling 1,500 active SKUs across multiple storage locations or job sites. Conducting weekly cycle counts and manual journal adjustments typically requires:
- Warehouse and logistics staff: 15 to 20 hours per week counting and cross-checking pick tickets.
- Accounting and data analysts: 8 to 12 hours per week investigating discrepancies, correcting ledger entries, and validating invoices.
- Management review: 3 to 5 hours per week approving stock adjustments and resolving customer escalations.
At an average fully loaded labor rate of $38 per hour across operational and analytical roles, manual reconciliation costs upwards of $55,000 to $70,000 annually in direct payroll alone. More critically, high-value personnel spend their time performing repetitive audit work instead of analyzing vendor terms, optimizing supply contracts, or improving customer lifetime value.
2. Discrepancy Multipliers and Phantom Inventory
When data synchronization lags behind warehouse activities, discrepancies compound. Known as “phantom inventory,” items listed as available in the system may already be damaged, misplaced, or allocated to an unfulfilled order.
The downstream financial consequences include:
- Cancelled orders and lost gross margin: Customers turn to competitors when promised orders cannot be fulfilled.
- Expedited freight costs: Rushed deliveries to replace missing items can erode up to 80% of product-level profit margins.
- Depreciation and obsolescence: Over-ordered buffer inventory sits untouched in secondary storage, eventually requiring markdown liquidation or total tax write-offs.
+--------------------------------------------------------------------------+
|                   THE HIDDEN COST OF MANUAL LOGS                         |
|                                                                          |
|  [ Spreadsheet Count ] ---> [ 48h Sync Lag ] ---> [ Phantom Stock ]      |
|                                                          |               |
|  [ Cash Drag / Idle Capital ] <--- [ Rush Reorders ] <----+              |
+--------------------------------------------------------------------------+
The Anatomy of Automated Inventory Updates
Automated inventory systems shift stock management from retrospective accounting to real-time, event-driven tracking. Every material movement—whether a supplier receiving slip, a transfer between regional hubs, or a work-in-progress consumption—updates central records instantaneously.
+--------------------------------------------------------------------------+
|                     REAL-TIME INVENTORY PIPELINE                         |
|                                                                          |
|  [ Purchase / Receipt ]                                                  |
|           │                                                              |
|           ▼                                                              |
|  [ Activity-Based Movement ] ──► [ Central Ledger Synced in Real Time ]  |
|           │                                      │                       |
|           ▼                                      ▼                       |
|  [ Proactive Threshold Hit ] ────────────────► [ Automated PO Triggered ]        |
+--------------------------------------------------------------------------+
Activity-Based Tracking vs. Periodic Batching
Periodic batch updates group transactions at the end of the day or week. By contrast, activity-based updates log changes at the exact moment an action occurs. When operational staff confirm an item pickup, dispatch, or milestone, the central database reflects the remaining quantities across all locations.
This continuous record creates an auditable trail, making end-of-month reconciliations virtually instantaneous. Financial controllers no longer need to halt operations for multi-day audits; the system maintains an audit-ready state at all times.
Location-Wise Stock Assignment
Multi-location operations often struggle with localized imbalances—having an overstock of materials in one regional depot while facing stockouts in another. Real-time visibility allows teams to balance stock across regional hubs, city depots, and job sites before placing redundant purchase orders.
Proactive Reorder Triggers: Mathematical Precision Over Guesswork
Traditional purchasing often relies on static min/max levels that fail to account for lead-time volatility or seasonal demand spikes. Proactive reorder triggers use dynamic safety stock calculations and automated alerting to optimize working capital.
Dynamic Reorder Point Formula
The foundational formula for an intelligent reorder point ($ROP$) is:
$$ROP = (D \times L) + SS$$
Where:
- $D$ = Average daily usage rate
- $L$ = Supplier lead time in days
- $SS$ = Safety stock required to protect against demand and supplier variability
To calculate safety stock with precision:
$$SS = Z \times \sqrt{(L \times \sigma_D^2) + (D^2 \times \sigma_L^2)}$$
Where:
- $Z$ = Service level factor (e.g., $1.65$ for a 95% service level)
- $\sigma_D$ = Standard deviation of daily demand
- $\sigma_L$ = Standard deviation of supplier lead time
Financial ROI of Proactive Triggers
When automated systems continuously recalculate these parameters based on real consumption data, businesses realize three distinct financial benefits:
- Reduction in Carrying Costs: Holding costs typically range between 20% and 30% of total inventory value annually (accounting for capital cost, insurance, storage, shrinkage, and taxes). By reducing excessive safety buffers by 15–25%, a company carrying $1,000,000 in inventory unlocks $30,000 to $75,000 in annual recurring savings.
- Elimination of Stockout Losses: Capturing demand without backorder friction directly protects top-line revenue.
- Optimized Vendor Volume Discounts: Rather than placing small, panic-driven orders, procurement teams can consolidate proactive reorders into predictable purchase batches to negotiate favorable pricing tiers.
Cross-Functional Applications: How Different Disciplines Leverage Inventory & Task Automation
While inventory automation is traditionally associated with warehouse storage, modern operations require cohesive tracking across diverse professional disciplines. Coordinated task and material management empowers teams across the organizational spectrum.
Industry / RolePrimary Tracking ChallengeAutomated SolutionMeasurable Financial ImpactCivil Engineers & InfrastructureMaterial staging across remote project phasesMilestone-linked inventory dispatchesEliminates project delay penalties & idle crew downtimeConstruction ContractorsSite-level shrinkage and equipment misplacementAsset check-in/out tied to job codes15–20% reduction in unbilled materials and lost toolsCorporate Decision MakersDelayed visibility into operational spendUnified executive dashboards & KPI reportsFaster resource allocation & zero surprise write-offsData AnalystsDirty, fragmented spreadsheet logsClean, structured, auto-synced data lakes70% reduction in data prep time; instant predictive modelingExecutive AssistantsManaging high-volume procurement & administrative logisticsAutomated recurring task flows & status alerts10+ hours saved weekly on routine follow-upsEngineering TeamsBill of Materials (BOM) tracking during prototype runsActivity-based component status updatesPrevents design delays and duplicate part fabricationEvent PlannersMulti-vendor delivery coordination & collateral trackingTimeline-based supply milestonesZero duplicate orders and seamless on-site executionEntrepreneurs & SMEsLean operational bandwidth across sales and fulfillmentAll-in-one task and stock platformsScales transaction volume without expanding headcountEducational InstitutionsCampus asset allocation, lab supplies, & maintenanceDepartment-level resource trackingEliminates lost equipment and optimizes annual grant spendingEcommerce BrandsMulti-channel stock sync & fast fulfillmentReal-time inventory-to-sales funnel trackingEliminates overselling penalties and marketplace bansFreelancers & ConsultantsProject deliverables, billable hours, and client assetsStructured task milestones & automated client alertsMaximizes billable realization rate and client retentionLarge EnterprisesSiloed regional hubs and access control governanceRole-based permissions & centralized multi-site viewsEnterprise-wide compliance and millions in spend optimizationCreatives & StudiosProduction gear tracking, licensing, and media assetsVisual stage pipelines & project asset checkoutsPrevents lost equipment and streamlines shoot turnaroundContent CreatorsSponsorship deliverables, production props, & media schedulesMulti-channel publishing workflowsConsistent release cadence and optimized brand partner revenue
1. Construction and Civil Engineering Workflows
On construction sites and major infrastructure projects, materials must arrive in sync with specific build phases. Utilizing dedicated task tracking tools for construction alongside material monitoring prevents costly staging errors. When civil engineers schedule concrete pours or structural steel assemblies, proactive material tracking with task tracking tools for civil engineers ensures supply availability, avoiding thousands of dollars per day in idle crane rentals and contractor standby fees. Similarly, technical task tracking tools for engineers streamline component testing and prototype revision schedules.
2. High-Growth Ecommerce and Omnichannel Retail
Modern ecommerce brands manage inventory across multiple fulfillment centers, Amazon FBA hubs, and regional warehouses. Deploying specialized task tracking tools for ecommerce that integrate directly with inventory funnels guarantees that stock levels remain synchronized across storefronts. This prevents cart abandonment caused by inaccurate delivery estimates and protects marketplace merchant ratings.
3. Executive Decision-Making, Analytical Modeling, and Enterprise Governance
For finance leaders, access to clean, real-time data is critical. Using automated task tracking tools for decision making allows executives to view consolidated reports on inventory velocity, vendor lead times, and cash conversion cycles in a single interface. At the same time, deploying modern task tracking tools for data analysts eliminates tedious manual cleanup, allowing analytical teams to build robust demand forecasting models directly on real-time data streams. For global operations, implementing a scalable task tracking tool for enterprises establishes uniform access controls, compliance audit trails, and multi-subsidiary governance across distinct operational divisions.
4. Education, Administrative Logistics, and Lean Operators
Educational institutions manage extensive assets across research laboratories, campus facilities, and academic departments. Implementing task tracking tools for education simplifies asset distribution, maintenance scheduling, and procurement audits across diverse faculties. Within corporate offices, task tracking tools for executive assistants automate recurring purchasing requests and executive project timelines, saving hours of weekly coordination overhead.
Even outside traditional supply chains, physical assets, production hardware, and project deliverables require rigorous coordination. Whether an event planning team manages venue logistics and high-value staging rentals with task tracking tools for event planning, or creative agencies track studio cameras and editing milestones with specialized task tracking tools for creatives, automated tracking prevents asset misplacement. Digital media teams also benefit when using task tracking tools for content creators to coordinate sponsor deliverables and post-production schedules. For solo operators utilizing task tracking tools for freelancers or small business founders implementing task tracking tools for entrepreneurs, automated workflows provide the operational discipline needed to scale without adding administrative headcount.
Quantifying the Direct Cost Savings: A Comprehensive Financial Model
To evaluate the return on investment (ROI) of replacing manual reconciliation with automated tracking, consider a mid-sized distributor with $5,000,000 in annual revenue, managing 2,000 SKUs across two distribution hubs.
+--------------------------------------------------------------------------+
|                 ANNUAL SAVINGS BREAKDOWN ($151,800 TOTAL)                |
|                                                                          |
|  Manual Reconciliation Labor     [██████████████] $46,800                |
|  Carrying Cost Optimization      [████████████]   $40,000                |
|  Eliminated Stockout Margins     [███████████████] $50,000               |
|  Expedited Freight Reductions    [████]           $15,000                |
+--------------------------------------------------------------------------+
Baseline Assumptions Before Automation:
- Average Inventory Value: $1,200,000
- Annual Inventory Carrying Cost Rate: 25% ($300,000/year)
- Manual Audit Time: 25 staff-hours/week across warehouse, accounting, and admin teams ($46,800/year)
- Stockout Rate: 3.5% of total customer orders, causing lost sales and backorder friction
- Annual Expedited Shipping Expenses: $22,000
- Deadstock / Write-Off Rate: 1.5% of inventory value annually ($18,000/year)
Financial Impact Post-Automation:
+------------------------------------+------------------+------------------+-----------------+
| Metric / Cost Category             | Pre-Automation   | Post-Automation  | Net Annual Gain |
+------------------------------------+------------------+------------------+-----------------+
| Reconciliation Labor Expense       | $46,800          | $4,680           | +$42,120        |
| Inventory Holding / Carrying Costs | $300,000         | $260,000         | +$40,000        |
| Lost Margin from Stockouts         | $70,000          | $20,000          | +$50,000        |
| Emergency / Expedited Freight      | $22,000          | $7,000           | +$15,000        |
| Shrinkage and Write-Off Losses     | $18,000          | $5,500           | +$12,500        |
+------------------------------------+------------------+------------------+-----------------+
| TOTAL ANNUAL VALUE CREATED         |                  |                  | $159,620        |
+------------------------------------+------------------+------------------+-----------------+
Return on Investment (ROI) and Payback Period
Assuming an annual software and implementation investment of approximately $8,000 across team tiers, the financial return is compelling:
$$\text{Net Annual Benefit} = $159,620 – $8,000 = $151,620$$
$$\text{First-Year ROI} = \left( \frac{$151,620}{$8,000} \right) \times 100 = 1,895%$$
$$\text{Payback Period} = \left( \frac{$8,000}{$159,620} \right) \times 12 \approx 0.60 \text{ months (approx. 18 days)}$$
With a payback period under three weeks, investing in comprehensive tracking tools provides immediate cash-flow relief and operational stability.
Key Task Tracking Tools Benefits for Operations
Understanding the broader task tracking tools benefits helps leadership teams justify the transition from legacy spreadsheets to automated systems:
- End-to-End Visibility: Central dashboards unite warehouse staff, field managers, procurement teams, and executive leadership behind a single source of truth.
- Actionable Alerts Over Manual Audits: Proactive system nudges replace frantic spreadsheet checks, warning managers before stock hits critical thresholds.
- Controlled Role-Based Permissions: Granular access controls ensure site managers only see relevant inventories while regional executives maintain high-level oversight.
- Seamless Scalability: Modern cloud architectures allow growing enterprises to add locations, SKUs, and user seats without requiring custom ERP overhauls.
Organizations exploring modern solutions can review flexible SME pricing plans to identify the deployment model that best aligns with their operational scale.
Implementation Roadmap: Moving from Chaos to Automation
To capture maximum cost savings, organizations should follow a structured five-step rollout:
Step 1: SKU Rationalization and Velocity Classification
Categorize all active items using ABC analysis:
- Category A (High Value, 70–80% of revenue): Subject to tight reorder triggers and continuous activity updates.
- Category B (Moderate Value, 15–20% of revenue): Monitored with standard automated reorder points.
- Category C (Low Value / Bulk, 5% of revenue): Managed with simplified batch alerts to minimize administrative overhead.
Step 2: Establish Real Lead-Time Baselines
Audit historical supplier performance over the past 6 to 12 months. Replace outdated static assumptions with realistic average lead times and variance buffers.
Step 3: Configure Role-Based Workflows and Escalation Paths
Set up automated alerts for operations, purchasing, and executive teams. Ensure low-stock notifications are routed directly to authorized decision-makers via dashboard alerts or instant mobile notifications.
Step 4: Integrate Material Tracking with Project Task Boards
Connect stock usage directly to milestone task completion across departments—whether field construction updates, marketing campaign collaterals, or manufacturing assembly stages.
Step 5: Monitor Variance and Reallocate Working Capital
Track inventory turns, holding costs, and reconciliation cycle times monthly. As working capital is unlocked from safety buffers, reallocate capital toward growth initiatives, marketing expansion, or supplier volume agreements.
Elevate Your Operational Efficiency with Stack Tracker
Eliminating manual reconciliation friction and automating inventory workflows is no longer reserved for Fortune 500 enterprises with multi-million-dollar custom tech stacks. Modern, AI-powered tools deliver enterprise-grade inventory intelligence and task management in an agile, cost-effective framework.
With Stack Tracker inventory and warehouse management software, businesses gain real-time visibility across multiple warehouse locations, automated reorder notifications, and activity-based updates powered by Tavi AI. Stop losing margin to stockouts, emergency orders, and administrative spreadsheet errors—transform your inventory into a streamlined, high-efficiency growth engine.
Leave a Reply